INPUT Research Methodology Defined
INPUT applied a well-defined research methodology to develop each research report. INPUT analysts employed this research methodology throughout the collection period.
The methodology remained constant while the service delivery modes, industry market sectors (aka vertical markets) and cross-industry (CI) markets changed as the industry grew and evolved.
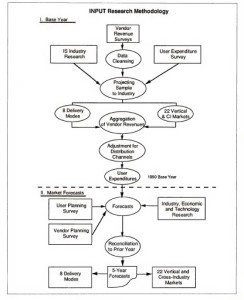
The exhibit at right presents an example of INPUT research methodology using service delivery modes and market sectors applicable in 1991.
INPUT surveyed vendors to determine their Information Services (aka IT Software and Services) revenues and to understand their views about market opportunities over the short- and long-term. INPUT surveyed information systems organizations (users) about their expenditures and plans. Primary survey methodology involved telephone and on-site interviews.
INPUT Forecasts
The annual forecasting process consisted of two major parts: base-year expenditure calculations and market forecasts, as described below.
Base-Year Expenditure Calculations
INPUT determined previous-year information services revenues for the 8 delivery modes and 22 industry and cross-industry sectors for hundreds of vendors. Estimates relied upon interviews, public data, and INPUT’S own estimates. Then, INPUT projected the initial data to represent the entire information services industry. Finally, INPUT made adjustments to eliminate duplications due to distribution channel overlap and to assure that captive information services expenditures were not included. This resulted in a base-year (e.g. 1991) user expenditure for each of the 22 vertical and cross-industry sectors and the 8 delivery modes.
Market Forecasts
In the forecasting step, INPUT surveyed information systems executives to determine their projected expenditure levels, both in aggregate and for each of the outside information services categories. In addition, INPUT conducted a second set of vendor interviews later in the year to obtain an understanding of how key vendors view the market and its opportunities. This resulted in a five-year forecast for each of the 22 vertical and cross-industry sectors and the 8 delivery modes. Correlation of delivery mode and market sector forecasts then occurred. To complete the process, INPUT reconciled its new forecasts with those from the previous year. Explanation of differences due to market restructuring and other factors was included. Clients used these projections to track INPUT’S forecasts from year to year.
Economic Assumptions
All INPUT forecasts use current currency measures (e.g., 1991 US market sizes are in 1991 dollars) including inflationary forecasts. In developing the five-year forecasts, INPUT incorporated economic assumptions for the U.S. and other economies as relevant. Specific assumptions applied are included in each INPUT report.
